Quick ggplot
Quick {ggplot} module
This module enables you to quickly upload datasets and make a {ggplot{blk}} in a second by using some functionalities from {Esquisse{blk}}.
Upload data
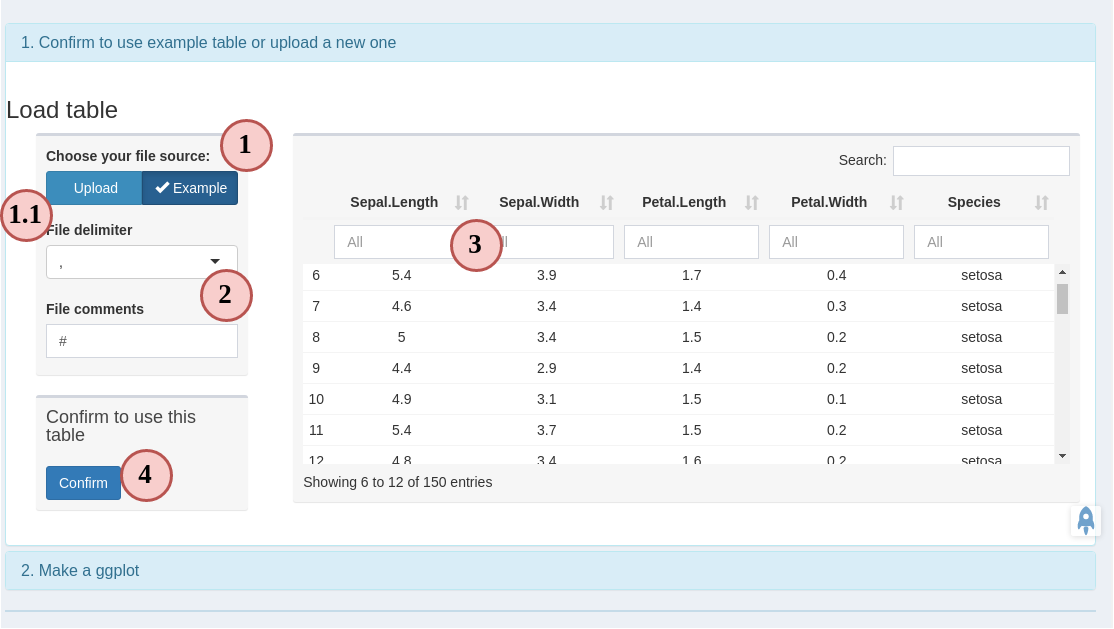
- The first thing you come to this module is to upload a tabular data file. You
can choose to use the example or upload your own. The example is just the
irisdata.- 1.1. If you choose to upload, there will be a upload button where you need to choose your own file.
- By default, it assumes you upload a “.csv” file with “#” as comments. If not you can choose the file delimiter and comment character.
- You can view your uploaded data and use the boxes below each column name to perform some filters, but you are not allowed to edit the data.
- If everything looks good, you can submit to proceed to the plot making panel.
Make a plot
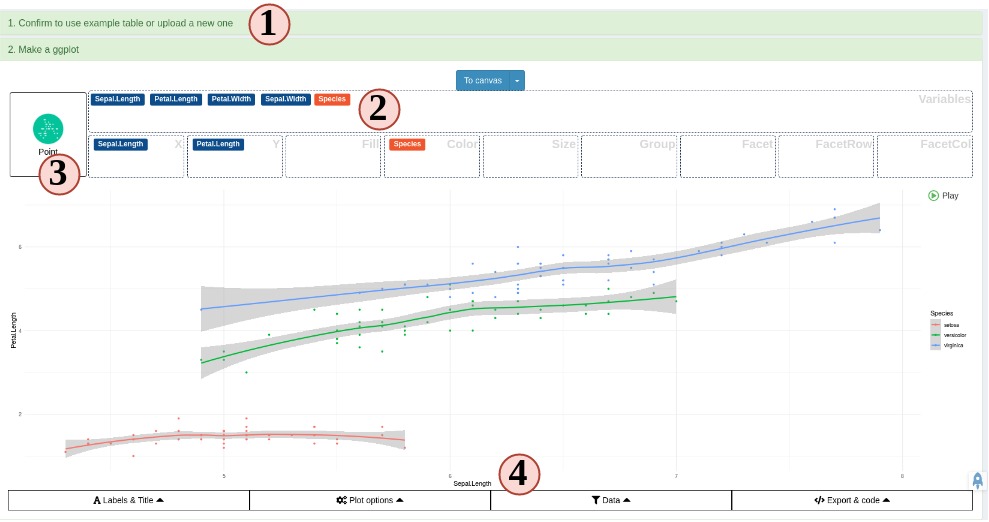
Figure 8 Quick ggplot
- Provide a tabular data table by uploading or use example.
- Drag variables from into different ggplot aesthetic boxes to make a ggplot.
- Change to different plot types.
- Customize other different plotting options.
For a more specific guide, read Esquisse official guide{blk}.
Last modified
2022-11-03
: Update ggplot.md (873f3f69)