Introduction
Main functionalities
Currently, SPS includes 3 main functional categories (Fig 1):
- Some pre-defined modules (tabs) include:
- A workbench for designing and configuring data analysis workflows,
- Downstream analysis and visualization tools for RNA-Seq, and
- A space to make quick ggplots.
- A section with user custom tabs: users define their own shiny tabs.
- An image editing tab “Canvas” which allows users to edit plots made from the previous two categories.
Besides, SPS provides many functions to extend the default Shiny development, like more UI components, server functions. Also, SPS has some useful general R ulitlies like error catching, logging, and more.
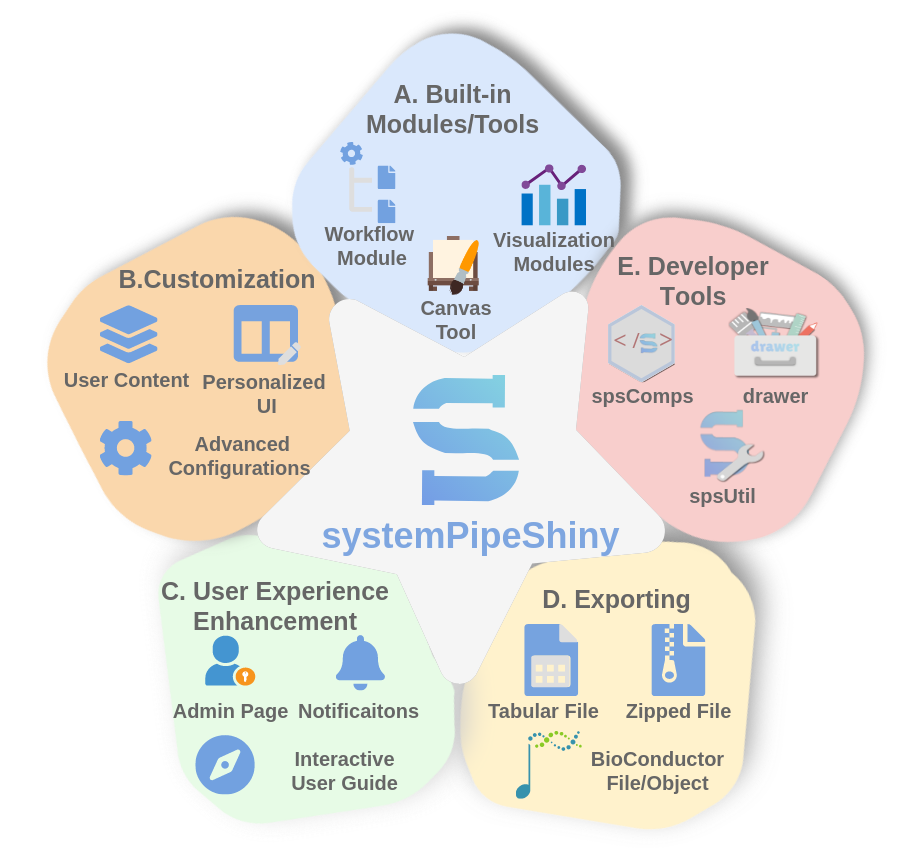
Figure 1. SPS Features
The framework provides an interactive web interface for workflow management and data visualization.
Detailed features
To know more about SPS features, find your favorite section below and click the link below to navigate to the section, or use the left sidebar menu to navigate.
SPS Features


X
![]()
Last modified
2021-12-15
: sps updates no_render (9924dd38)