t-Distributed Stochastic Neighbor embedding with tSNEplot
tSNEplot.RdThis function computes and plots t-Distributed Stochastic
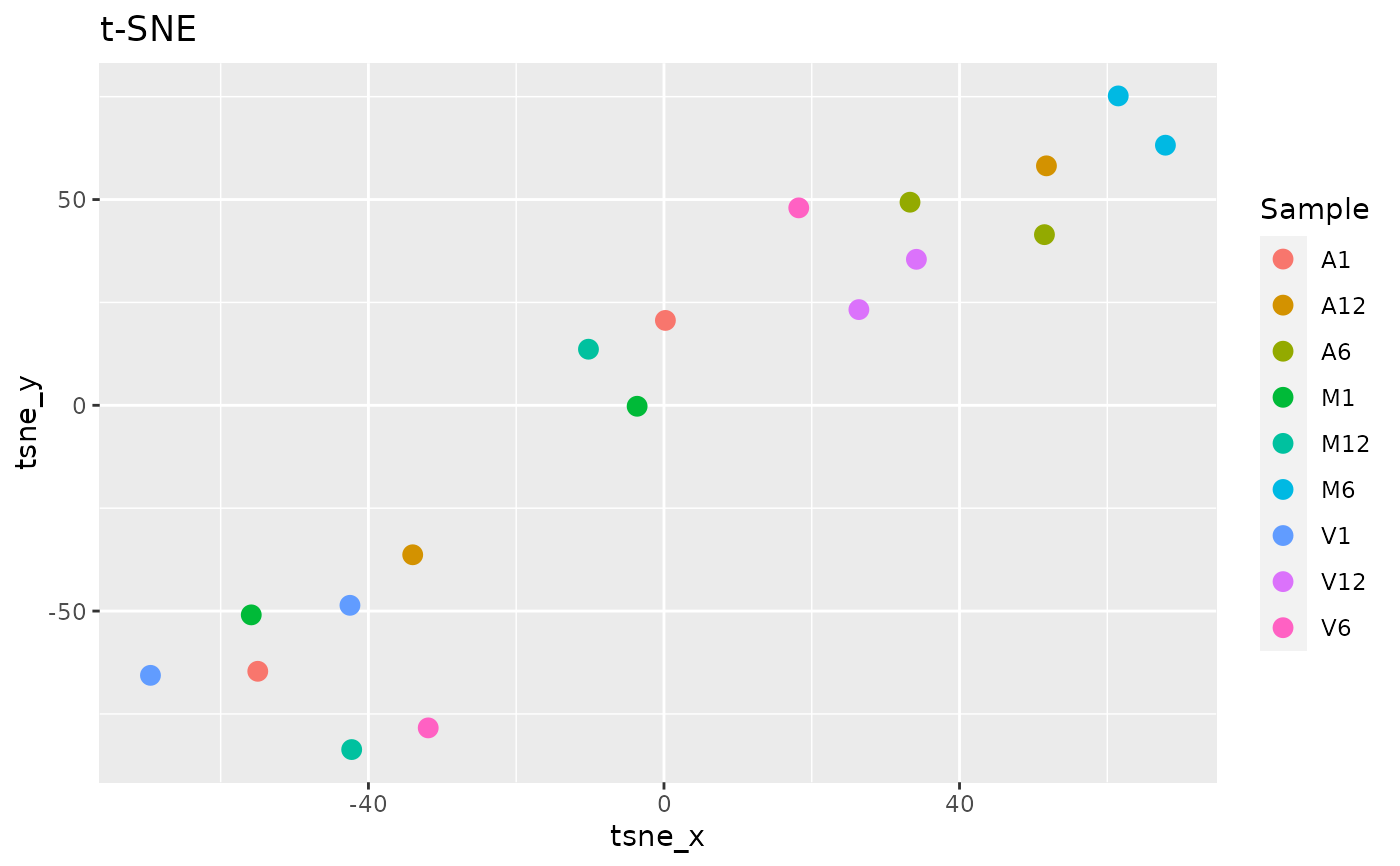
Neighbor embedding (t-SNE) analysis for unsupervised nonlinear
dimensionality reduction of count expression matrix. Internally, it is
applied the
Rtsne::Rtsne() function, using the exact t-SNE computing with theta=0.0.
tSNEplot(
  countMatrix,
  targets,
  plotly = FALSE,
  savePlot = FALSE,
  filePlot = NULL,
  ...
)
Arguments
| countMatrix |
|
|---|---|
| targets | targets |
| plotly | logical: when |
| savePlot | logical: when |
| filePlot | file name where the plot will be saved. For more
information, please consult the |
| ... | additional parameters for the |
Value
returns an object of ggplot or plotly class.
References
Jesse H. Krijthe (2015). Rtsne: T-Distributed Stochastic Neighbor Embedding using a Barnes-Hut Implementation, URL: https://github.com/jkrijthe/Rtsne
Examples
targetspath <- system.file("extdata", "targets.txt",
package = "systemPipeR")
targets <- read.delim(targetspath, comment = "#")
cmp <- systemPipeR::readComp(file = targetspath, format = "matrix",
delim = "-")
countMatrixPath <- system.file("extdata", "countDFeByg.xls",
package = "systemPipeR")
countMatrix <- read.delim(countMatrixPath, row.names = 1)
set.seed(42)
tSNEplot(countMatrix, targets, perplexity = 5)