Hierarchical Clustering HeatMap (heatMaplot)
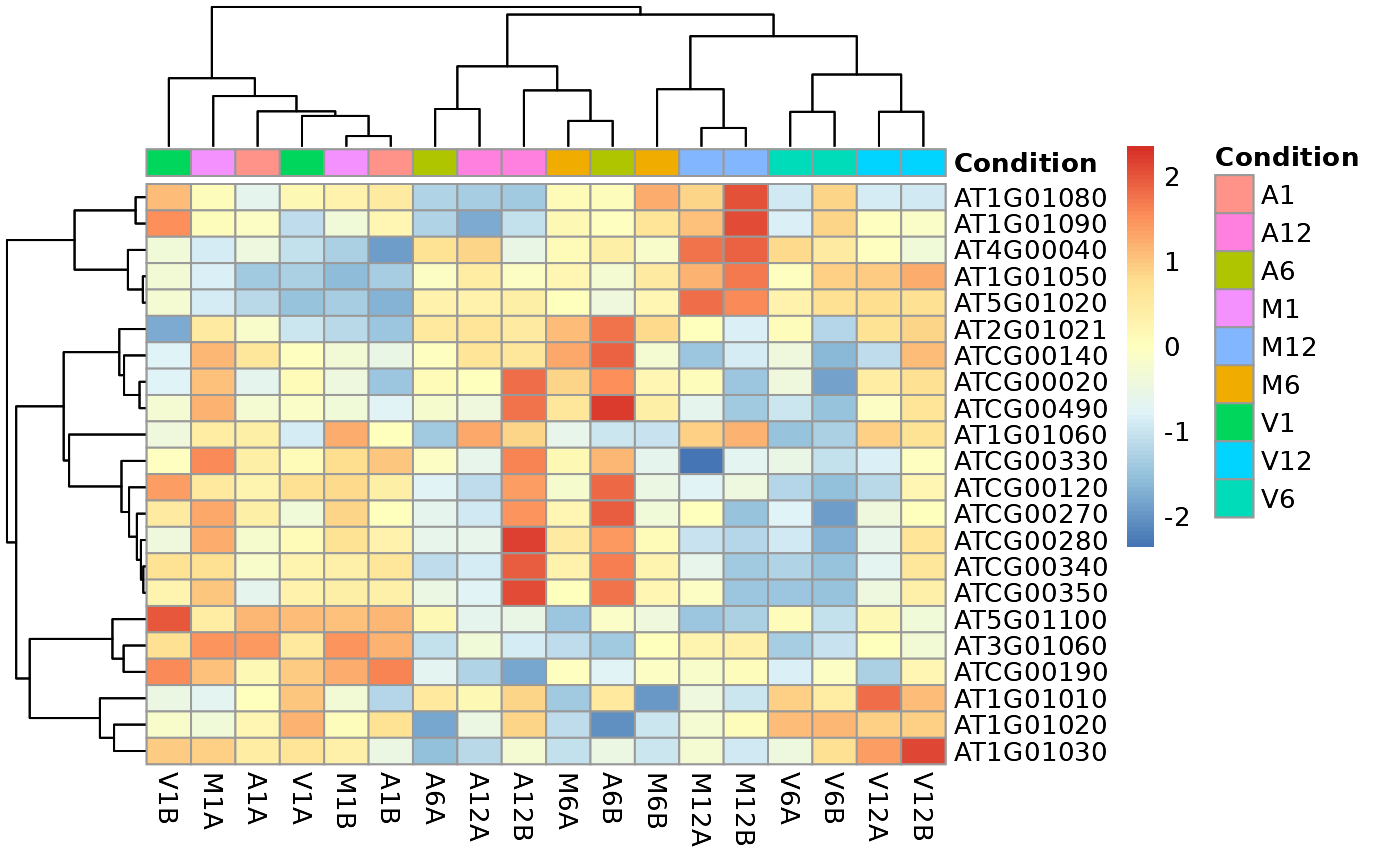
heatMaplot.RdThis function performs hierarchical clustering on the transformed expression matrix generated with the DESeq2 package. It uses, by default, a Pearson correlation-based distance measure and complete linkage for cluster join.
heatMaplot(
  exploredds,
  clust,
  DEGlist = NULL,
  plotly = FALSE,
  savePlot = FALSE,
  filePlot = NULL,
  ...
)
Arguments
| exploredds | object of class |
|---|---|
| clust | select the data to apply the distance matrix computation.
If |
| DEGlist | List of up or down regulated gene/transcript identifiers
meeting the chosen filter settings for all comparisons defined in data
frames |
| plotly | logical: when |
| savePlot | logical: when |
| filePlot | file name where the plot will be saved. For more information,
please consult the |
| ... | additional parameters for the |
Value
returns an object of pheatmap or plotly class.
References
Raivo Kolde (2019). pheatmap: Pretty Heatmaps. R package version 1.0.12. https://CRAN.R-project.org/package=pheatmap
Examples
### Load data targetspath <- system.file("extdata", "targets.txt", package = "systemPipeR") targets <- read.delim(targetspath, comment = "#") cmp <- systemPipeR::readComp(file = targetspath, format = "matrix", delim = "-") countMatrixPath <- system.file("extdata", "countDFeByg.xls", package = "systemPipeR") countMatrix <- read.delim(countMatrixPath, row.names = 1) ## Samples plot exploredds <- exploreDDS(countMatrix, targets, cmp = cmp[[1]], preFilter = NULL, transformationMethod = "rlog" ) heatMaplot(exploredds, clust = "samples", plotly = TRUE) ## Individuals genes identified in DEG analysis ### DEG analysis with `systemPipeR` degseqDF <- systemPipeR::run_DESeq2( countDF = countMatrix, targets = targets, cmp = cmp[[1]], independent = FALSE )#> Warning: some variables in design formula are characters, converting to factors### Plot heatMaplot(exploredds, clust = "ind", DEGlist = unique(as.character(unlist(DEG_list[[1]]))) )

