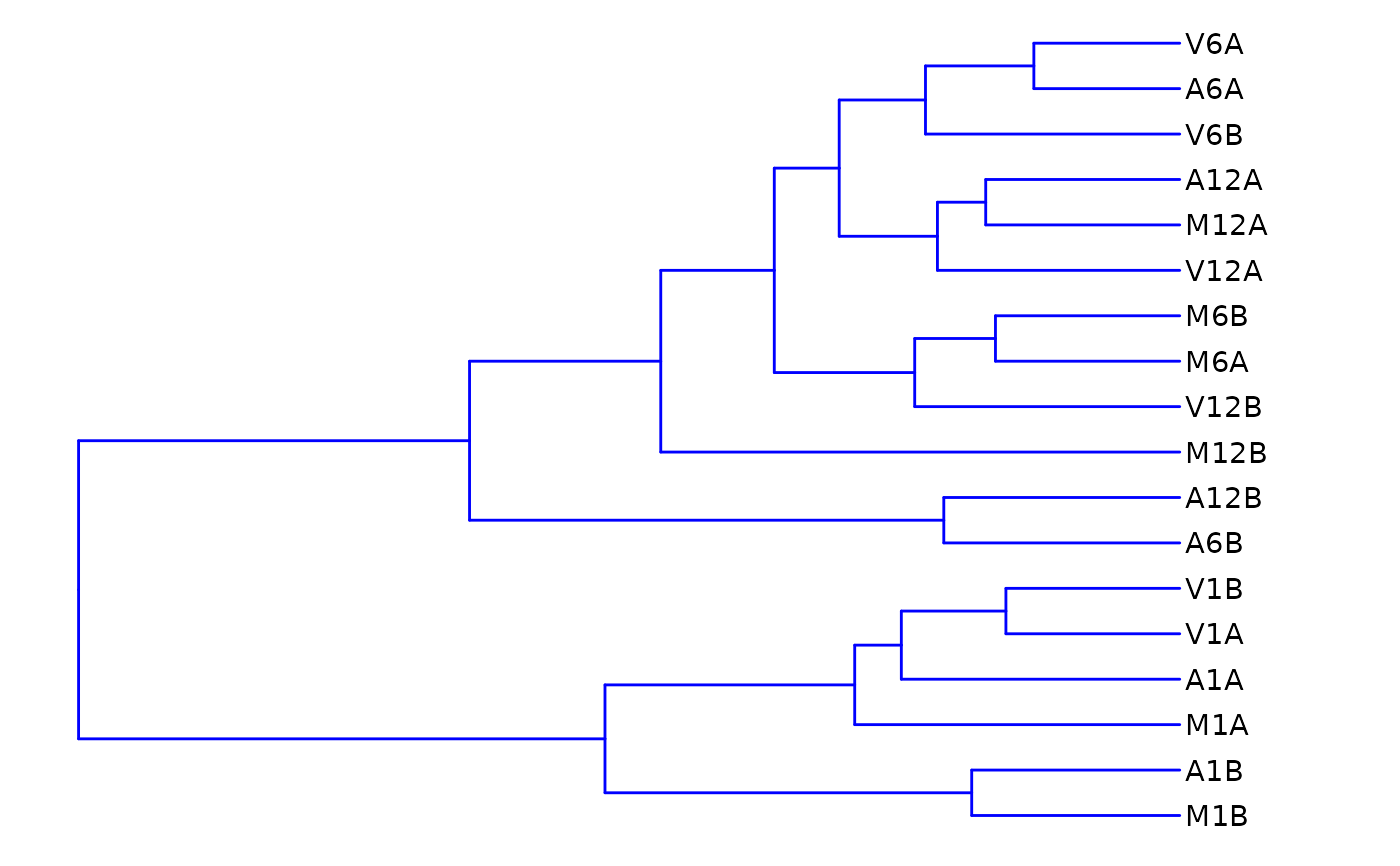
Hierarchical Clustering Dendrogram (hclustplot)
hclustplot.RdThis function computes the sample-wise correlation coefficients
using the stats::cor() function from the transformed expression values.
After transformation to a distance matrix, hierarchical clustering is
performed with the stats::hclust() function, and the result is plotted as
a dendrogram.
hclustplot(
  exploredds,
  method = "spearman",
  plotly = FALSE,
  savePlot = FALSE,
  filePlot = NULL
)
Arguments
| exploredds | object of class |
|---|---|
| method | a |
| plotly | logical: when |
| savePlot | logical: when |
| filePlot | file name where the plot will be saved. For more information,
please consult the |
Value
returns an object of ggplot or plotly class.
Examples
## Targets file
targetspath <- system.file("extdata", "targets.txt",
package = "systemPipeR")
targets <- read.delim(targetspath, comment = "#")
cmp <- systemPipeR::readComp(file = targetspath,
format = "matrix", delim = "-")
## Count table file
countMatrixPath <- system.file("extdata", "countDFeByg.xls",
 package = "systemPipeR")
countMatrix <- read.delim(countMatrixPath, row.names = 1)
## Plot
exploredds <- exploreDDS(countMatrix, targets,
    cmp = cmp[[1]],
    preFilter = NULL, transformationMethod = "rlog"
)
hclustplot(exploredds, method = "spearman")